Bing Maps: Shaded Map
A thematically shaded map allows us to display records using particular geographical boundaries. In the UK, we might use Postal Area, Postal District or Postal Sector. This allows us to look at the distribution of our customers or prospects around the country.
For example, to see the UK distribution of Australian holidaymakers:
-
Create a selection to identify people who have been to Australia.
-
Drag the Map
 tool from the Visualisation section of the Toolbox ribbon bar onto your selection.
 -
At the top of the window, select the Layer 1 tab.
Options
| Map Layer Title | Enter the description to be shown on the layer tab and legend display |
| Resolve Table & Filter | Set the table level and any record filter here to determine the records shown e.g. People or Household figures |
| Map Type | Choose between the Shaded and Plot Map options |
| Default Display Style | When viewing the Map results select to show the Descriptions or Codes for items |
| Geographic Variable | Drag and drop here the geographical variable to determine how the data will be shown on the Map |
| Segment Variable | Allows you to segment the data by the selection variable used, displayed as pie, column charts etc. |
| Statistics Panel | This area displays all the statistics that have been added for possible display on the map |
| Add Statistics… | The statistics window allows you to define which statistics will be made available in the statistics panel |
| Help… | Click this link to open the FastStats Help files |
| Display MapPoint Wizard for Next Build | Displays the wizard each time the map is built so you can change the graph type and other options |
-
Drag and drop the Postal Area variable onto the Geographic Variable drop-box.
-
Build
 to create the Shaded Map display:
Thematics
The thematic options for applying shading to a FastStats Map are the same as those you have when creating a Cube or Tree.
By default, shading is applied based on Quantiles - here 10 bands.
To edit or change this:
-
Click to select Thematic in the Layers panel.

In the Edit layer thematic... dialog:
-
Click on the Type drop-down to access and select the required Thematic.
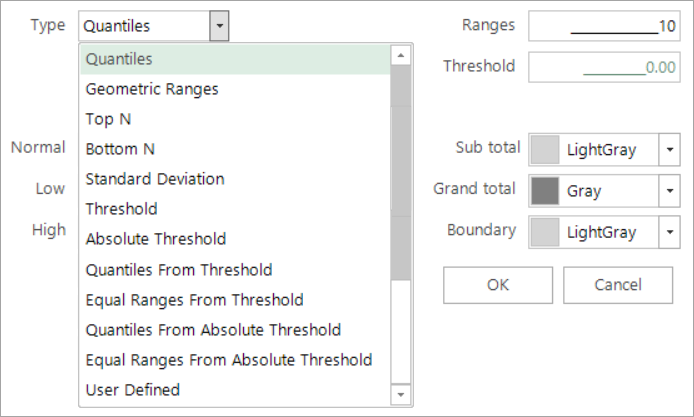
-
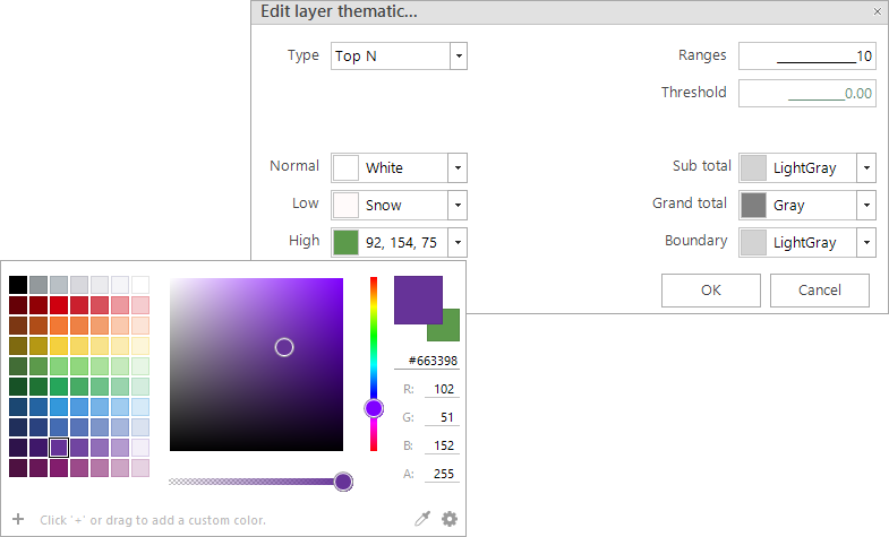
Amend Ranges and Threshold settings when relevant.
If you wish to amend the thematic colours, simply use the drop-down menus at the bottom of the dialog:
If none of the standard thematic types matches the data you require, you can choose User Defined and set your own ranges. These ranges can be entered in any order that makes sense for your data, and they do not have to be contiguous.
Related topics: